
How AI is transforming traditional monitoring tools into an intelligent, unified, and self-healing cloud operations ecosystem.
The Challenge: Too Many Tools, Too Little Insight
Modern enterprises rely on a patchwork of monitoring tools, Prometheus for metrics, Zabbix for infrastructure health, AWS CloudWatch for cloud visibility, Kubernetes for container orchestration, and SolarWinds for network performance.
Each tool is powerful on its own, yet together they often create data silos, alert fatigue, and slow response times. Teams spend hours manually correlating logs, metrics, and alerts to find the root cause of an issue.
The result?
- Slower incident resolution
- Escalating operational costs
- Unpredictable system reliability
That’s where AI-powered observability steps in, unifying these tools into an autonomous, intelligent monitoring fabric.
AI: The Missing Link in Cloud Monitoring
Traditional monitoring systems detect problems; AI systems understand and prevent them.
By layering AI on top of Prometheus, Zabbix, CloudWatch, Kubernetes, and SolarWinds, enterprises can:
- Detect anomalies before they become incidents
- Automatically perform root-cause analysis (RCA)
- Recommend or trigger remediation actions
- Continuously learn from past behavior to optimize performance
This isn’t just an upgrade — it’s a paradigm shift from reactive monitoring to proactive intelligence.
How AI Integrates Across Your Monitoring Stack
1. Prometheus: Predictive Insights on Metrics
AI consumes Prometheus time-series data through APIs or exporters, learning performance baselines for every node, service, and application. When latency or error rates deviate from normal patterns, AI predicts potential degradation and triggers alerts before user impact occurs.
Example:
“The web service latency is trending 30% above baseline, predicted saturation in 45 minutes.”
2. Zabbix: Intelligent Infrastructure Correlation
Zabbix offers detailed monitoring of network devices, VMs, and hardware. AI augments it by correlating data across domains, connecting a network spike in Zabbix to a container slowdown in Kubernetes, for example.
This cross-tool reasoning eliminates manual triage.
3. Kubernetes: Autonomous Cluster Optimization
Using Kubernetes APIs and metrics-server data, AI tracks pod health, resource allocation, and deployment drift. It can recommend scaling actions, detect unhealthy nodes, or auto-roll back faulty updates. With memory of prior events, AI learns what “normal” looks like for your cluster.
4. AWS CloudWatch: Cloud-Scale Predictive Monitoring
CloudWatch feeds cloud-level telemetry — EC2 performance, load balancer latency, and application logs, into the AI model.
The AI correlates these signals with on-prem metrics (via Zabbix or Prometheus) to give a true hybrid visibility layer, detecting issues that span both environments.
5. SolarWinds: Network Intelligence and Anomaly Detection
SolarWinds data is rich in topology and network flow context. AI models detect unusual traffic patterns, predict bandwidth exhaustion, or highlight devices that frequently cause latency.
It connects network anomalies directly to application performance impact.
The Unified Intelligence Layer
Together, these integrations form an AI-powered observability layer that sits above your existing tools. This layer acts as a brain — continuously analyzing, correlating, and learning from telemetry data across all domains.
It can:
- Prioritize alerts based on business impact
- Automatically open or resolve incidents
- Trigger self-healing workflows (e.g., restart a Kubernetes pod or scale a cluster)
- Communicate findings via Slack, Teams, or email
Key Capabilities of AI-Driven Observability
| Capability | Traditional Monitoring | AI-Powered Observability |
|---|---|---|
| Data Handling | Metrics and logs viewed separately | Cross-domain correlation and contextual awareness |
| Alerting | Static thresholds | Adaptive, behavior-based alerts |
| RCA | Manual investigation | Automated root-cause analysis |
| Remediation | Human-driven | Self-healing workflows |
| Learning | None | Continuous pattern learning and optimization |
Real-World Impact
- 50% Reduction in Operational Costs By automating routine NOC and SRE tasks, teams can focus on innovation instead of firefighting.
- 3× Faster Incident Resolution AI-driven RCA and automated remediation cut downtime drastically.
- 85% Fewer False Alerts Smart correlation means less noise, more signal.
- Unified Multi-Cloud Visibility A single view across AWS, Azure, GCP, and on-prem environments — without replacing existing tools.
Chat with Your Infrastructure
The next leap forward is Conversational Operations — the ability to simply ask your infrastructure what’s happening. With assistants like Wanclouds AI, engineers can say:
“Show me the pods in Kubernetes with CPU usage trending above baseline.”
“Explain why CloudWatch is showing higher latency today.”
“Check Zabbix for any network anomalies related to the API gateway.”
This natural-language interface removes barriers between people and systems, turning complex monitoring into a simple conversation.
The Future of AIOps
AI-powered observability is not just about automation — it’s about autonomy. As models continue to learn, enterprises will evolve from monitoring to self-managing infrastructure.
The future stack will feature:
- Continuous adaptive learning
- Autonomous remediation pipelines
- Explainable AI insights
- Cloud-to-edge visibility
Wanclouds AI embodies this future today — integrating seamlessly with Prometheus, Zabbix, CloudWatch, Kubernetes, and SolarWinds to deliver smarter, faster, and more resilient multi-cloud operations.
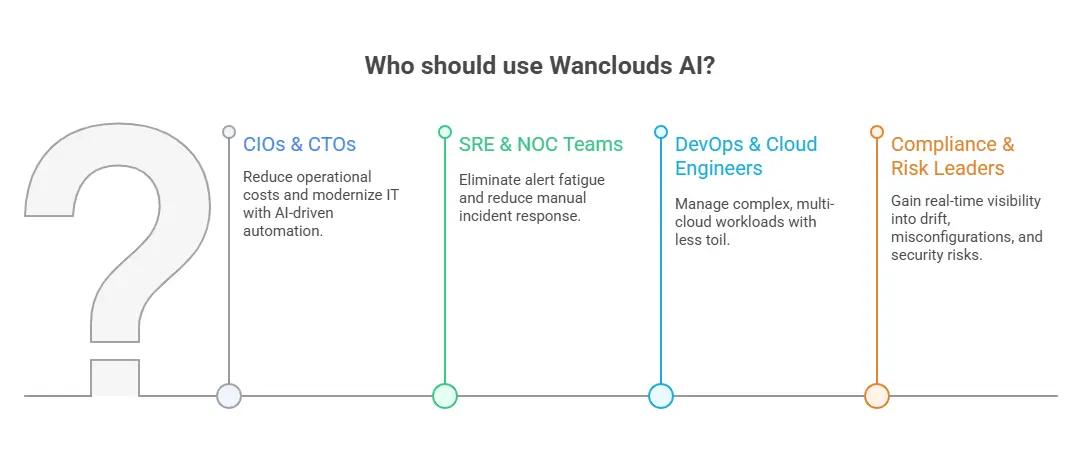
Who Should Use Wanclouds AI?
Wanclouds AI is designed for a range of stakeholders across IT and business:
- CIOs & CTOs – Cut operational costs and modernize IT with AI-driven automation.
- SRE & NOC Teams – Eliminate alert fatigue and reduce manual incident response.
- DevOps & Cloud Engineers – Manage complex, multi-cloud workloads with less toil.
- Compliance & Risk Leaders – Gain real-time visibility into drift, misconfigurations, and security risks.
Trusted by Global Leaders
Wanclouds AI is already powering some of the world’s most demanding enterprises, including IBM, Cisco, and QAD. With proven multi-cloud expertise across AWS, Azure, GCP, IBM Cloud, and more, it delivers the scale, security, and reliability that Fortune 1000 organizations require.
Wanclouds AI vs. Traditional IT Ops
| Challenge | Legacy IT Ops | Wanclouds AI |
|---|---|---|
| Alert Fatigue | Manual triage required | AI auto-triage & resolution |
| Resolution Time | Hours/days | Seconds/minutes |
| Cost Structure | High OPEX (large teams) | Up to 50% savings |
| Reliability | Inconsistent | Self-healing, always-on |
| Toolchain | Fragmented silos | Unified visibility |
| Compliance | Manual audits | Continuous drift detection |
Conclusion
The next generation of IT and cloud operations belongs to those who can see across silos, act before failure, and learn continuously. By combining the best of existing tools with the intelligence of AI, enterprises can achieve a new standard of reliability, agility, and cost efficiency.
Wanclouds AI is leading this transformation — helping teams chat with their infrastructure, automate routine tasks, and unlock the full potential of their cloud ecosystem.