
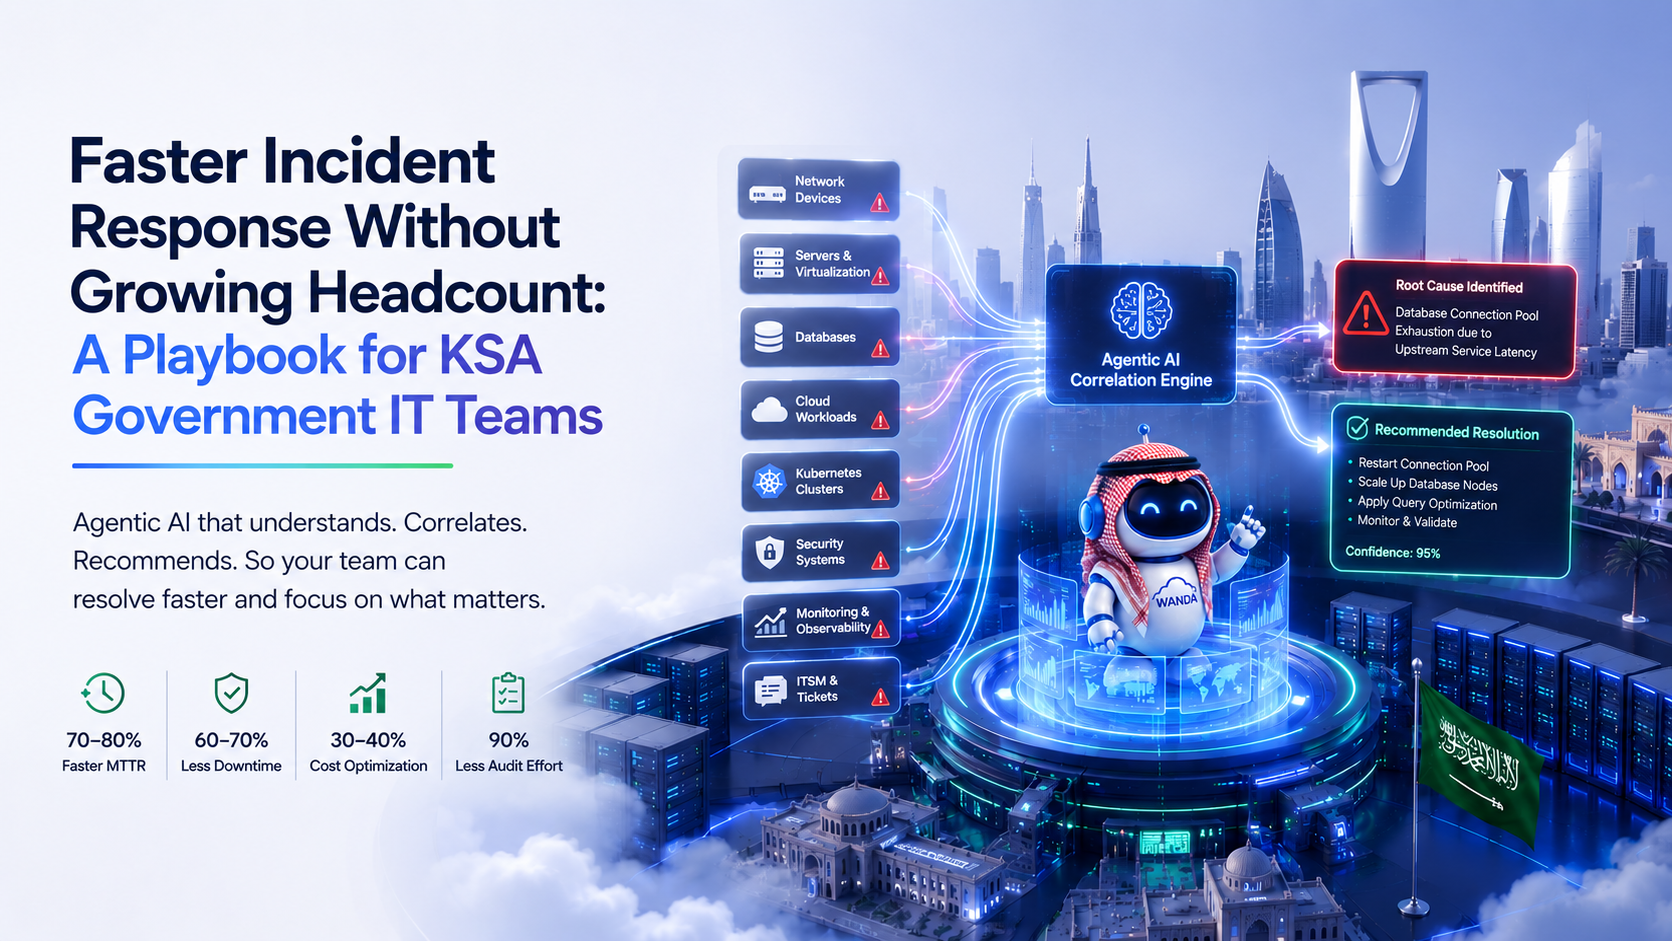
Saudi government IT teams face a paradox. Citizen-facing digital services are expanding fast under Vision 2030, but the headcount to monitor and maintain that infrastructure isn't growing at the same pace. The result: more systems, more alerts, and the same-sized team trying to keep up.
Faster incident response doesn't have to mean a bigger team. It means a smarter one.
The Real Bottleneck: Alert Volume, Not Talent
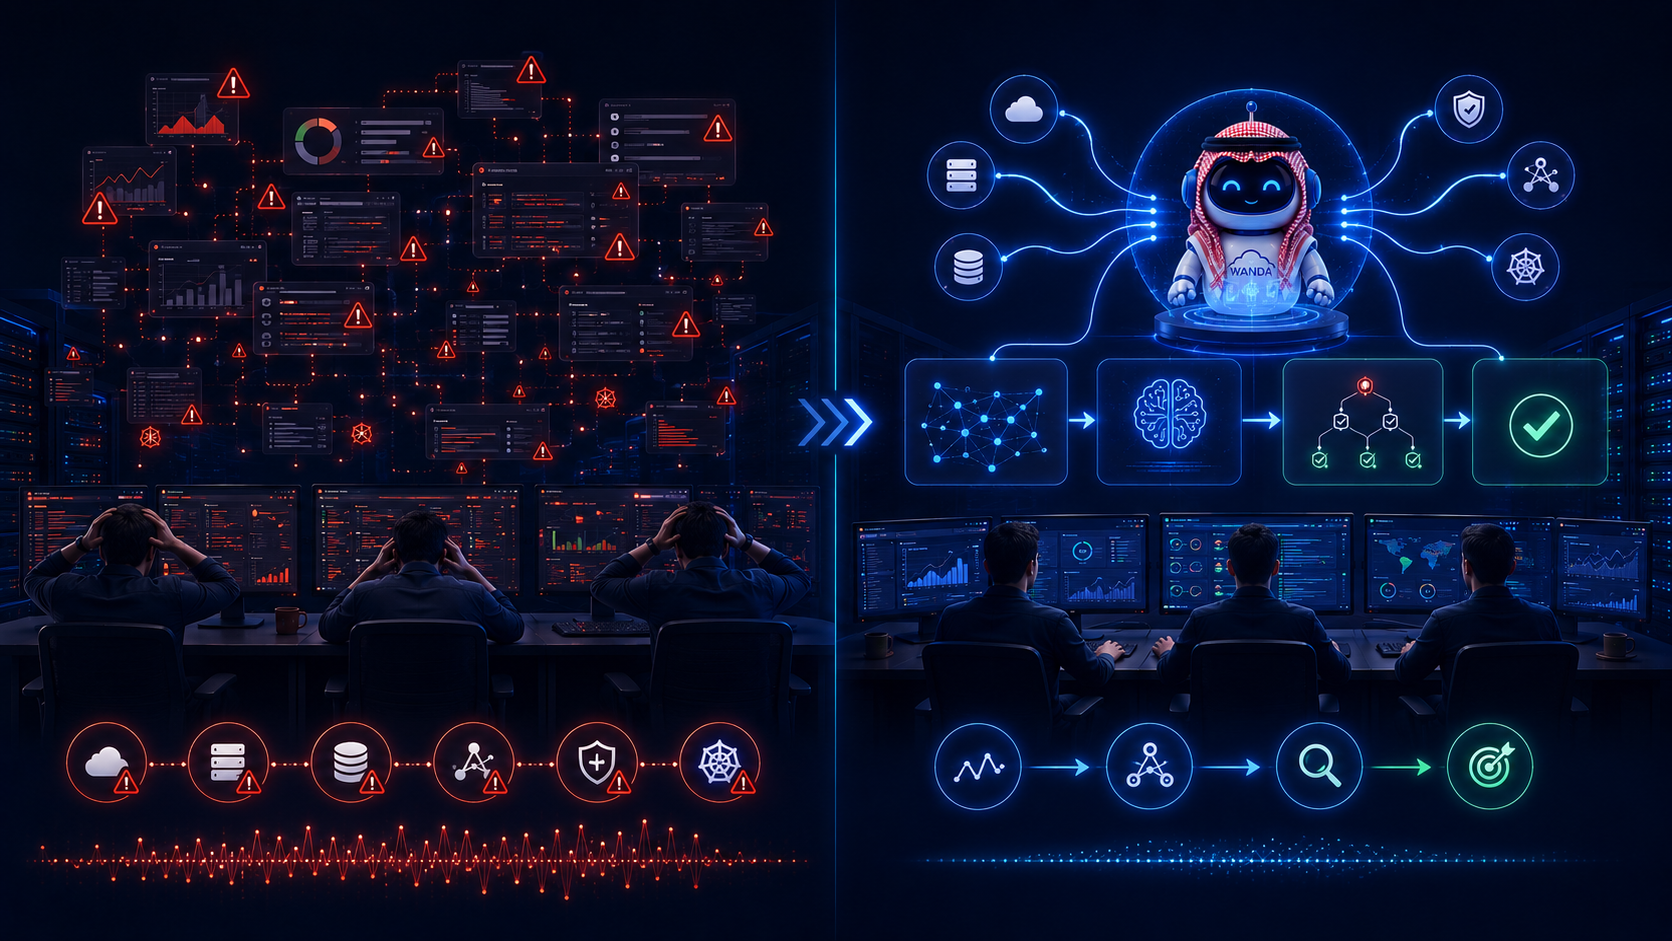
Government IT environments are inherently multi-vendor: firewalls, routers, VMware, Windows and Linux servers, databases, and increasingly Kubernetes and cloud workloads all running side by side. Each system generates its own alerts, logs, and dashboards. When something breaks, engineers spend more time correlating data across tools than actually fixing the problem.
This is the core issue behind slow incident response in the public sector: not a lack of skilled people, but a lack of unified visibility across fragmented systems. Static dashboards show data. They don't explain what happened, why, or what to do next. A network engineer might see a spike in latency. A security analyst might see an unrelated login anomaly. A database administrator might see a slow query. Without cross-domain correlation, three people investigate three symptoms of the same root cause, in parallel, without realizing it.
That's not a staffing problem. It's a tooling problem being solved with people instead of systems.
Why Legacy Tools Make This Worse, Not Better
Most government IT environments already have monitoring in place, that's not the gap. The gap is that legacy monitoring and ITSM platforms were built to show data, not deliver answers. They generate alert floods that require manual runbooks to interpret. They operate in tool silos, so a firewall alert, a server metric, and a ticketing system entry never get connected automatically. And they're fundamentally human-dependent: every correlation, every root-cause hypothesis, every "what changed before this broke" question requires a person to manually stitch the story together.
Adding more dashboards doesn't fix this. It adds more places to look. The answer is an intelligent infrastructure layer that connects with the tools already in place, correlates signals across the environment, and helps detect, diagnose, and resolve issues automatically.
What "Faster Without Growing Headcount" Actually Looks Like
Agentic AI platforms shift incident response from manual triage to autonomous root-cause analysis. Instead of an engineer pulling logs from five different tools, a government IT team can ask a single question in plain language:
- "What caused last night's outage of the citizen portal database?"
- "Which systems violate our security baselines right now?"
- "Give me an executive summary of the last 24 hours."
- "What changed before performance degraded?"
Behind the scenes, this requires cross-layer correlation, tracing an issue from infrastructure to application to network to security, so incident context is built automatically instead of assembled by hand. Alert de-duplication and noise reduction filter out the flood so the team sees signal, not volume.
That's the mechanism that drives real MTTR reduction: organizations deploying this kind of platform typically see 70–80% reductions in incident resolution time and 60–70% less unplanned downtime, without adding a single new headcount line to the budget. Over time, cost optimization compounds too, typical deployments report 30–40% infrastructure cost optimization from idle resource detection and right-sizing recommendations that legacy dashboards never surface on their own.
Why This Matters More for Government Than Anywhere Else
Three pressures make this especially urgent for KSA public sector IT.
Citizen-facing services can't afford downtime. Digital government platforms are a visible measure of Vision 2030 progress. An outage isn't just an internal IT problem; it's a public trust issue, and it's the kind of failure that gets noticed outside the IT department.
Compliance can't slow down operations. Government IT environments in KSA operate under stringent security, compliance, and data-sovereignty requirements, including frameworks and regulations such as NCA ECC and DGA requirements, depending on the organization and workload, alongside broader standards like ISO, PCI, and SOC2 where applicable. Manual audit prep is a resource drain on already-stretched teams; audit-ready evidence generation and configuration drift detection built into daily operations remove that burden instead of adding to it. Organizations report up to 90% reduction in compliance audit effort when this is automated rather than manually assembled before every review cycle.
The talent pipeline hasn't caught up to the infrastructure build-out. New systems are deployed faster than teams can be trained to monitor them. Memory-driven operations, AI that retains knowledge of past incidents, known failure patterns, and organizational policy, help preserve institutional knowledge even as staff rotate, reducing dependency on any one person's tribal knowledge. When a senior engineer leaves, the knowledge of "how we fixed this last time" shouldn't leave with them.
A Practical Playbook: Four Steps for Government IT Teams
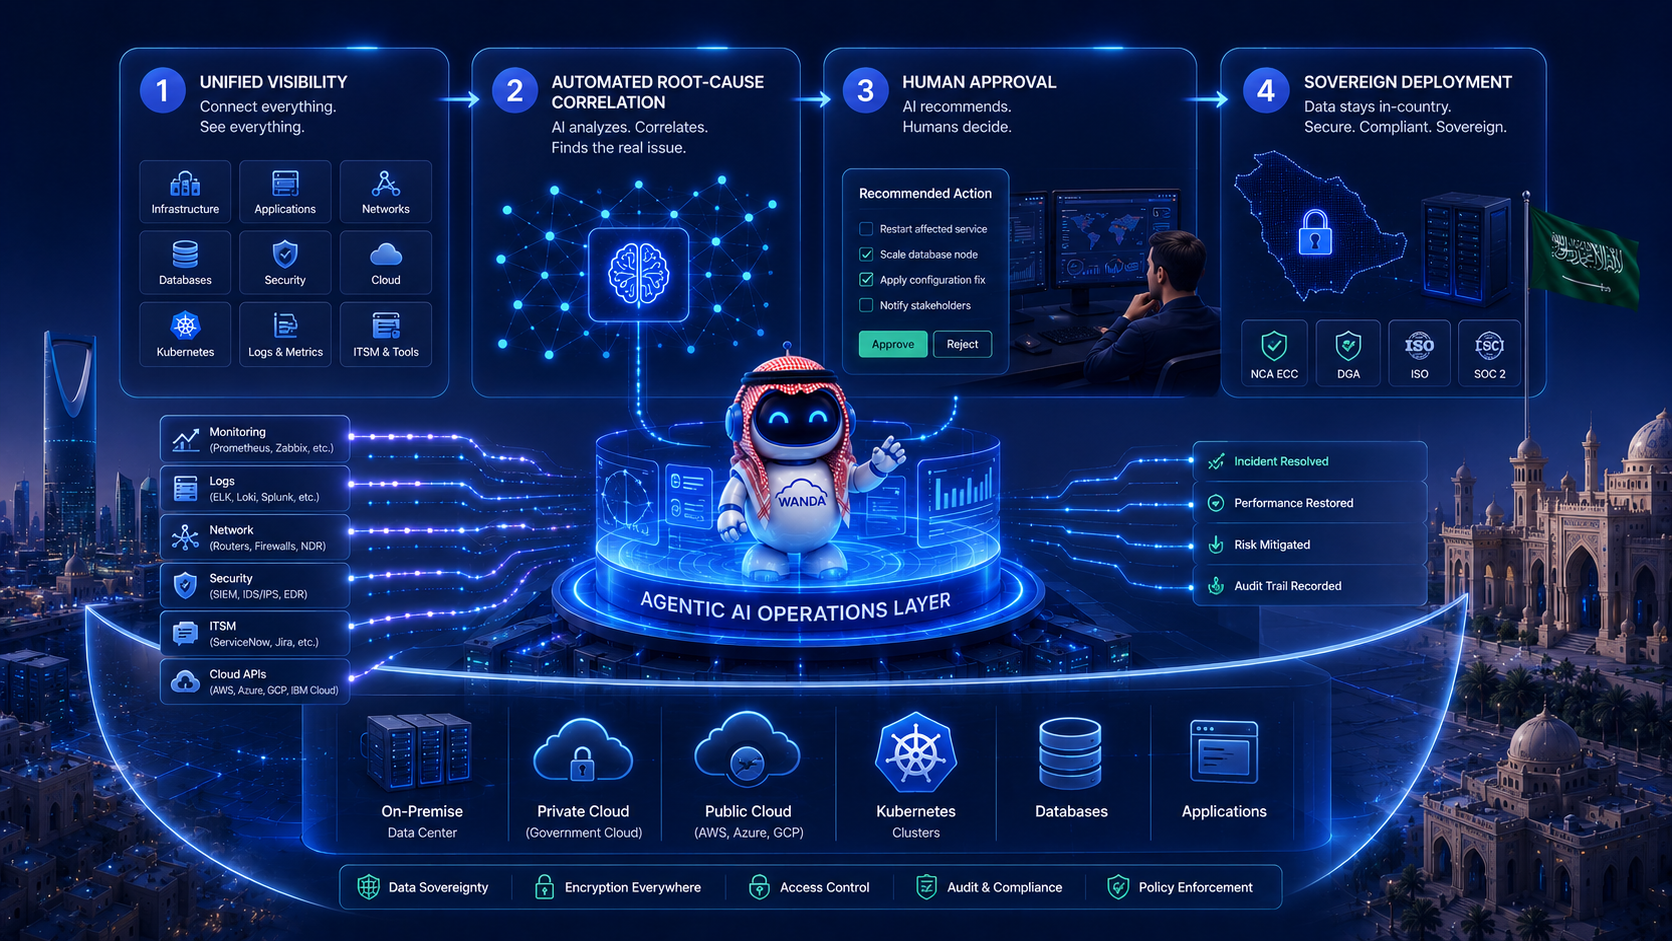
1. Consolidate visibility before adding tools. Before buying another point solution, unify what you already have. Look for platforms that connect to existing monitoring, logging, and ITSM tools Prometheus, Zabbix, Splunk, Loki, ServiceNow, Jira, and similar, rather than replacing them outright. No agents required, where possible, and no vendor lock-in should be a non-negotiable requirement for any new layer added to government infrastructure.
2. Automate root-cause correlation, not just alerting. Alert de-duplication and noise reduction matter, but the bigger win is automatic incident context, understanding what changed before performance degraded, without a manual investigation across five different consoles.
3. Keep humans in control of changes. Autonomy in analysis doesn't mean autonomy in action. Any platform touching government infrastructure should require explicit human confirmation for state-changing operations, create, update, delete, so automation accelerates insight while a person still approves execution. Every interaction and action should be logged and auditable by design, not as an afterthought.
4. Choose deployment that matches your data residency requirements. Government workloads often require full data sovereignty. Look for flexible deployment options, private instance in a public cloud, fully managed on-premise deployment, or a sovereign/regulated cloud region, so no citizen or government data leaves the environment, and no personally identifiable information is shared outside it.
What This Looks Like in Practice
Picture a government IT team supporting a citizen services portal, a set of internal databases, and a mix of on-premise servers and cloud workloads. Historically, a performance degradation event means opening four tools, cross-referencing timestamps by hand, and escalating through two or three people before anyone has a working theory of what happened.
With cross-domain correlation in place, that same event surfaces as a single, plain-language summary within seconds: what broke, what changed beforehand, which systems were affected, and what the likely fix is. The team still makes the call and approves the fix, but the hour of manual detective work is gone. That hour, multiplied across every incident in a month, is where the headcount problem quietly resolves itself.
The Bottom Line
Growing a government IT team to match growing infrastructure isn't realistic on most budgets or timelines. Growing what that team can see, correlate, and resolve in seconds is. That's the difference between adding headcount and multiplying the capacity of the team already in place, and it's the kind of operational leverage Vision 2030's pace of digital transformation demands.
See WANDA in Action
Reading about faster incident response is one thing, watching it work on real multi-vendor infrastructure is another. Watch our recent webinar demo to see WANDA correlate an outage across servers, network, and security layers in real time, with no dashboards and no scripting involved.
Prefer a live walkthrough tailored to your environment? Request a personalized WANDA demo