
Here's a hunch: nobody on your team can list every tool you're paying for.
That's not sloppiness. Tool sprawl creeps in one integration at a time: a monitoring tool here, an incident manager there, a logging platform someone spun up during an outage two years ago and never turned off. Each choice made sense at the time. Together, they add up to a stack that costs more in subscriptions, troubleshooting hours, and context switching than most teams realize.
You don't have to guess at that number. Try the WANDA Tool Sprawl Calculator → and get a personalized breakdown in about two minutes.
What Is Tool Sprawl?
Tool sprawl is the buildup of overlapping monitoring, logging, incident management, automation, and cloud tools across an IT or DevOps environment, to the point where managing the tools takes real effort of its own. For a deeper look at how it happens, see our guide to why DevOps practices rely on too many tools.
The Three Hidden Costs of Tool Sprawl
Tool sprawl hits your budget in three separate places, which is why it's so easy to underestimate.
1. Tool Subscription Costs
Datadog, PagerDuty, Splunk, New Relic: the invoices are real, but they're scattered across budget lines, so nobody adds them up.
2. Troubleshooting Time Costs
Every incident means checking a monitoring dashboard, then a cloud console, then a logging tool, then maybe Slack, before anyone can start fixing the problem. That time is paid at engineer salaries, not software prices, and it rarely shows up as a "cost" anywhere.
3. The Cost of Context Switching
This is the sneaky one. Every time an engineer jumps between tools, there's mental overhead from re-orienting in a new interface, on top of the incident itself. Multiply that by every engineer, every switch, every day, and it's often the largest number in the equation.
Individually, each cost feels manageable. Added together, for a mid-sized team running half a dozen tools across multi-cloud infrastructure, the total can reach ~10k-50k a year, spent maintaining complexity instead of shipping.
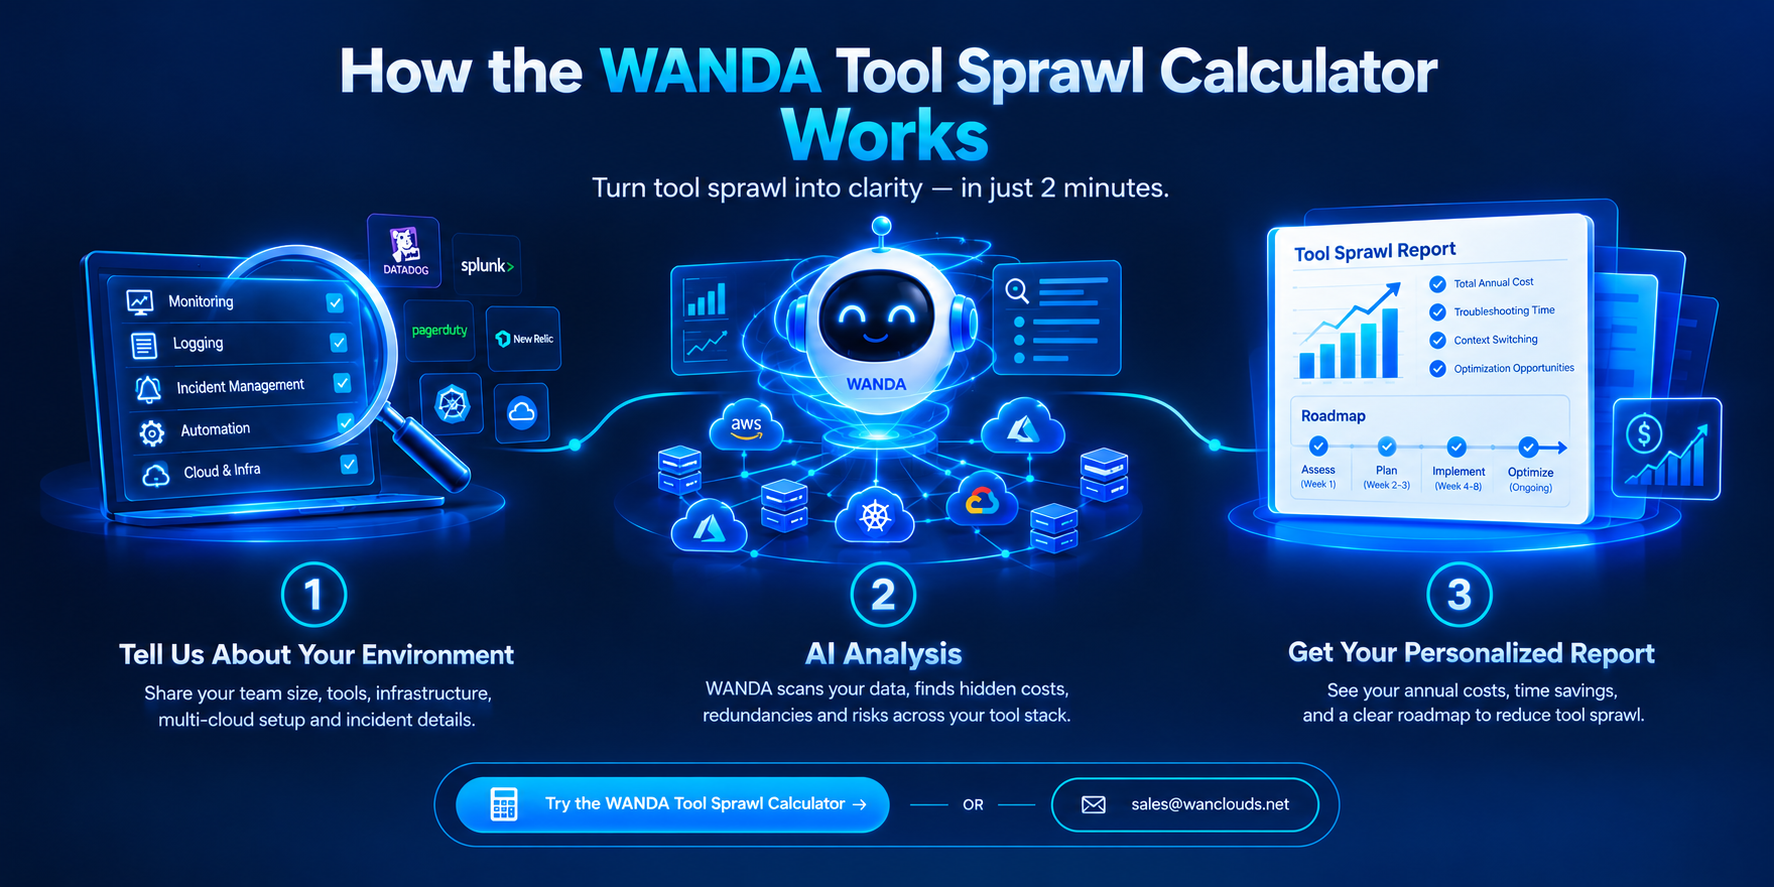
How the Tool Sprawl Calculator Works
It takes two minutes. Tell it:
- How many people are on your DevOps/SRE team
- Which tools you use (monitoring, incident management, logging, automation, and more)
- How much infrastructure you manage
- Whether you run multi-cloud or hybrid
- How long a typical incident takes to troubleshoot
- How many incidents you handle per week
It then returns your annual tool spend, troubleshooting time cost, context-switching cost, and grand total.
Why the Number Surprises People
Most teams are surprised because nobody had connected all three costs in one place. A team paying $20K a year in subscriptions might find that context switching costs many times that in lost engineering hours. That's not a knock on the team. It's what happens when infrastructure work spreads across six interfaces that were never designed to talk to each other.
How to Reduce Tool Sprawl with WANDA
WANDA gives your team a single conversational interface across the tools and infrastructure you already run. Instead of hopping between a monitoring dashboard, a cloud console, an automation tool, and a logging platform, your team asks WANDA and gets an answer, without the tool-switching in between.
That's the mechanism behind the savings the calculator shows:
- Tool consolidation: fewer platforms to pay for and maintain
- Faster troubleshooting: one interface instead of stitching data together from five, with automated root cause analysis
- Less context switching: the biggest line item for most teams, cut when the answer is one conversation away instead of four tabs away
For multi-cloud teams with a meaningful incident load, the payback can come quickly, often within the first year. Curious how this fits into modern operations? Read What Is an AI SRE? and What Is AIOps?.
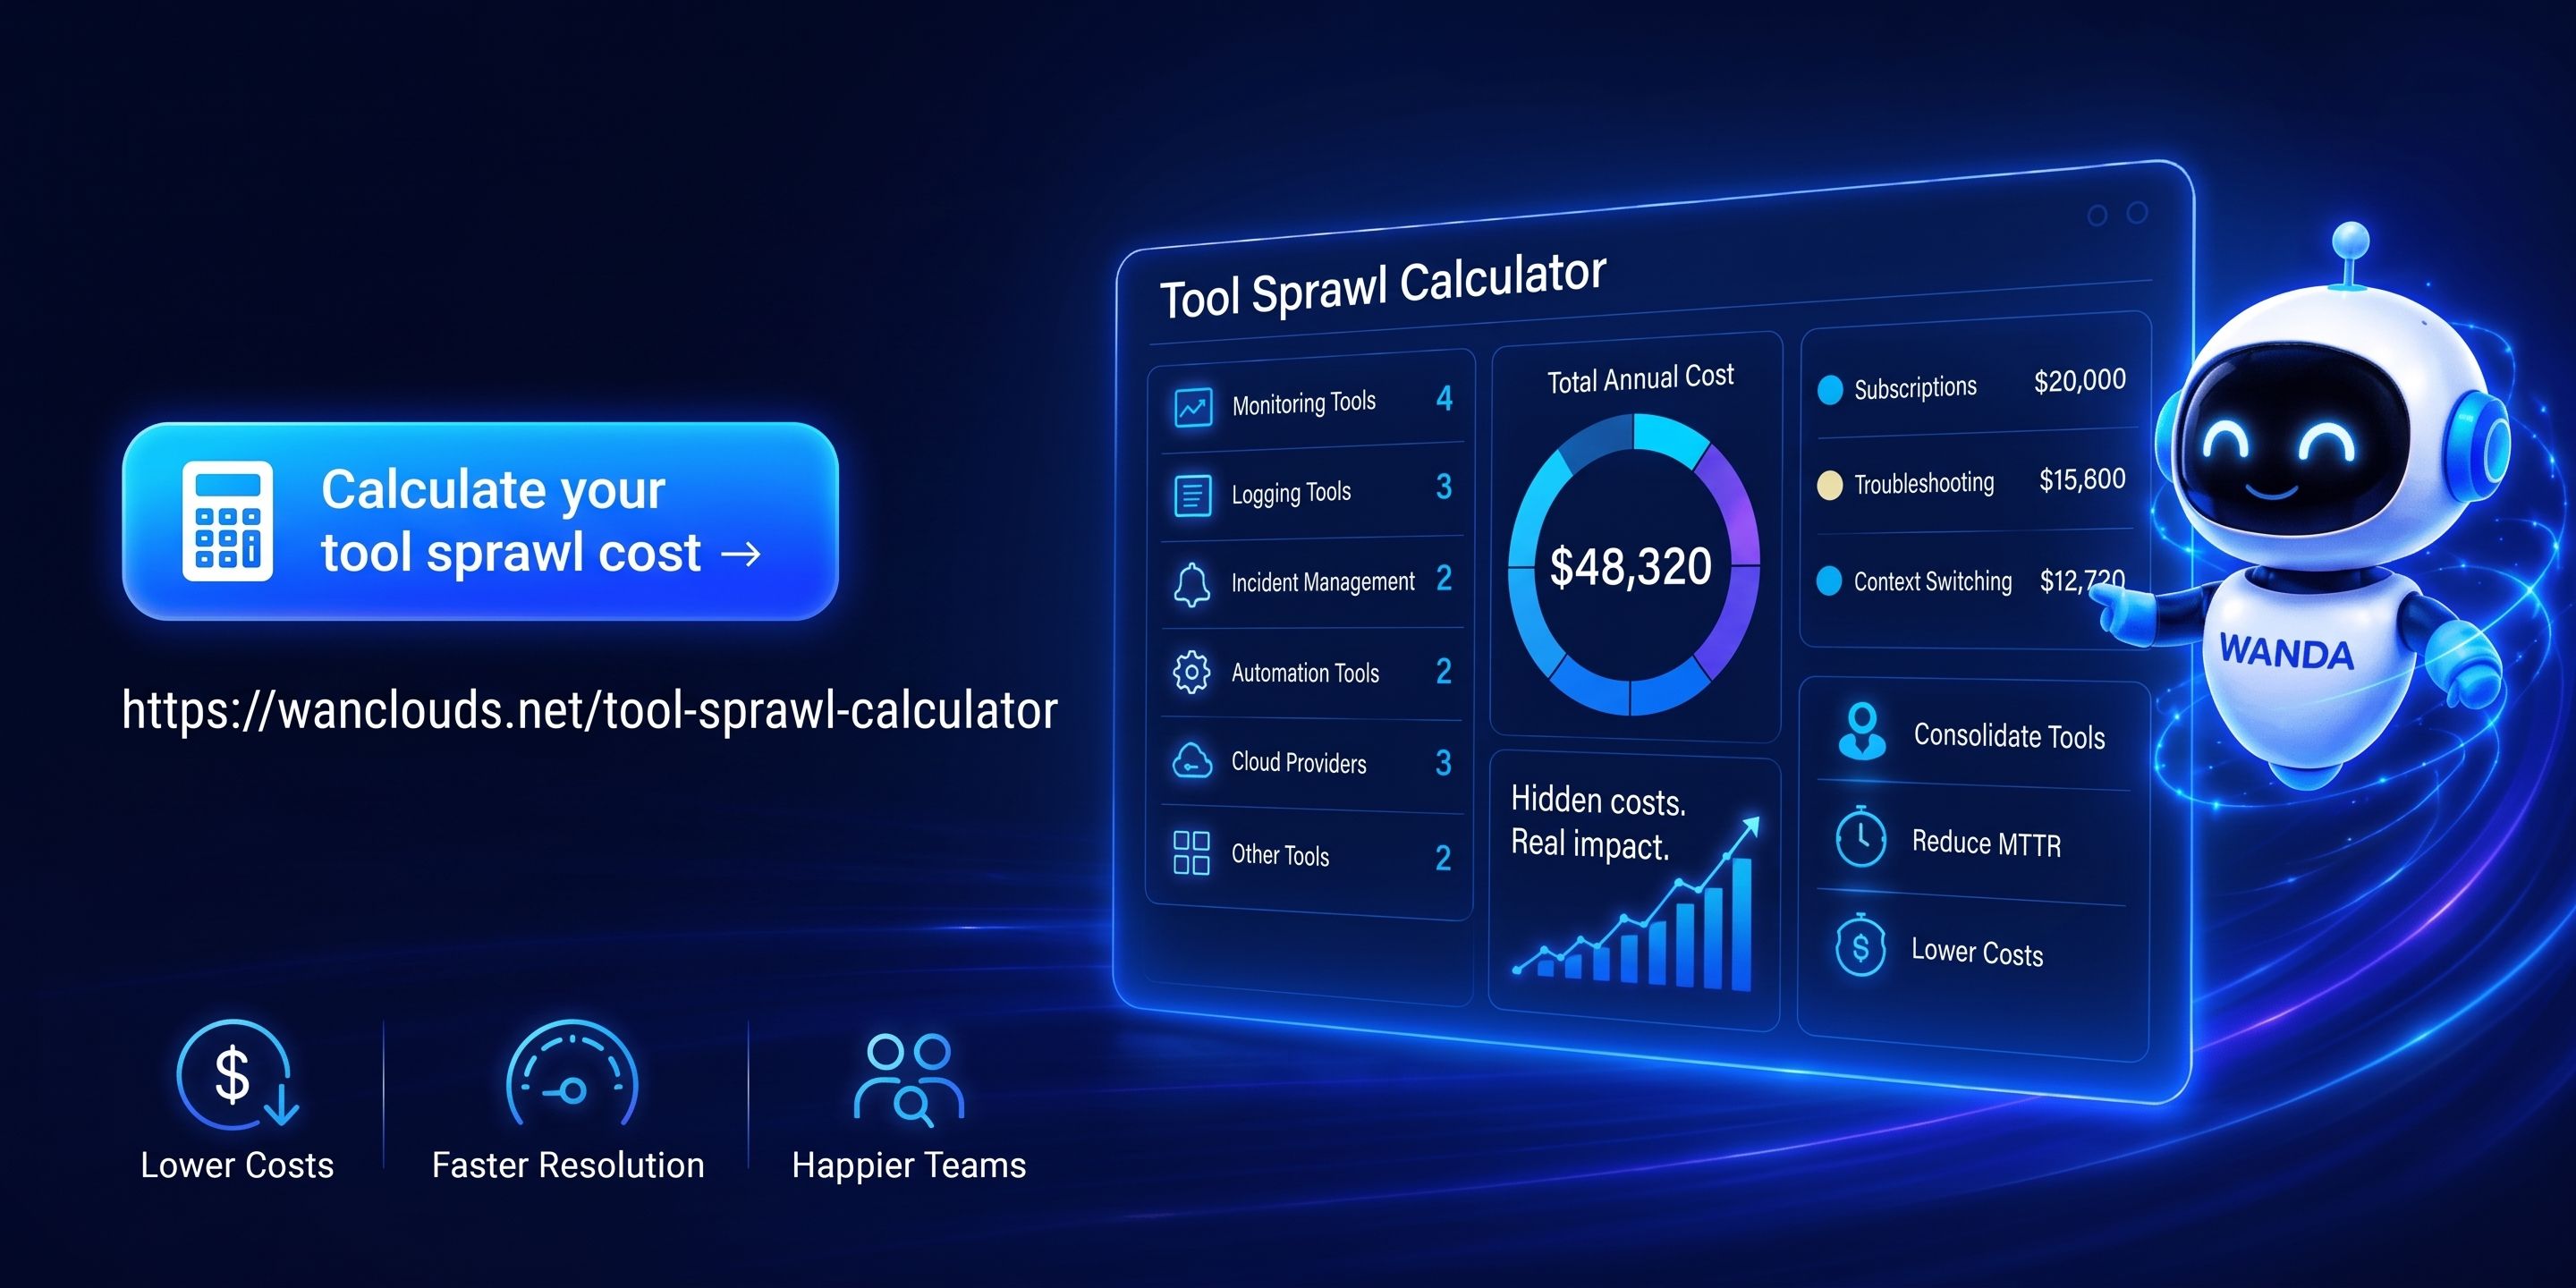
See Your Own Number
Run your team's actual numbers and see where you land.
Calculate your tool sprawl cost with WANDA →
From there, start a free trial, book a quick demo, or take the number back to your team and see what conversation it starts.